Are you staring at your KPI dashboard, wondering why these metrics matter?
It’s not just numbers on a screen. They tell a story. A story about how your Global Business Services (GBS) operation is performing. They can highlight inefficiencies, celebrate successes, and guide your next strategic moves.
I’ve spent over two decades in the trenches of the outsourcing and offshoring industry. Let me tell you, mastering KPI dashboards is like having a compass in the vast ocean of shared services transformation. Without it, you’re just drifting, hoping to find land.
Understanding KPIs: The Heart of Your Dashboard
So, what are KPIs, and why should you care?
- Key Performance Indicators (KPIs) are metrics that help you gauge the success of your operations.
- They provide insights into various aspects of your business, like financial performance, process efficiency, and customer satisfaction.
- Each KPI has a purpose, and aligning them with your strategic goals keeps your team on the right track.
A simple example: If your sales team has a KPI to increase customer satisfaction scores by 20%, that’s a direct line to their daily activities. Focusing on KPIs is not just about tracking numbers; it’s about driving behavior.
Crafting Your KPI Dashboard
Creating a KPI dashboard isn’t just about picking pretty graphs. Start with understanding your objectives.
- Define your business goals.
- Identify the data sources you need to measure those goals.
- Choose KPIs that align with both your current and long-term objectives.
It’s tempting to load up your dashboard with every metric under the sun, but less is often more.
Keep It Lean
Focus on 5-7 KPIs. Here’s why:
- Stakeholders often appreciate brevity over complexity.
- By keeping it concise, you can concentrate on what truly drives your GBS success.
Consider utilizing dashboards as process optimization tools. They can identify bottlenecks, allowing you to tweak processes on the fly.
Data Visualization: Making Numbers Speak
Ever tried deciphering a wall of data?
Great dashboards utilize data visualization techniques to turn raw data into actionable insights. When the numbers come to life, it’s easier for your team to digest what’s happening. Use colors, charts, and graphs to convey your story. It’s about making the complex simple.
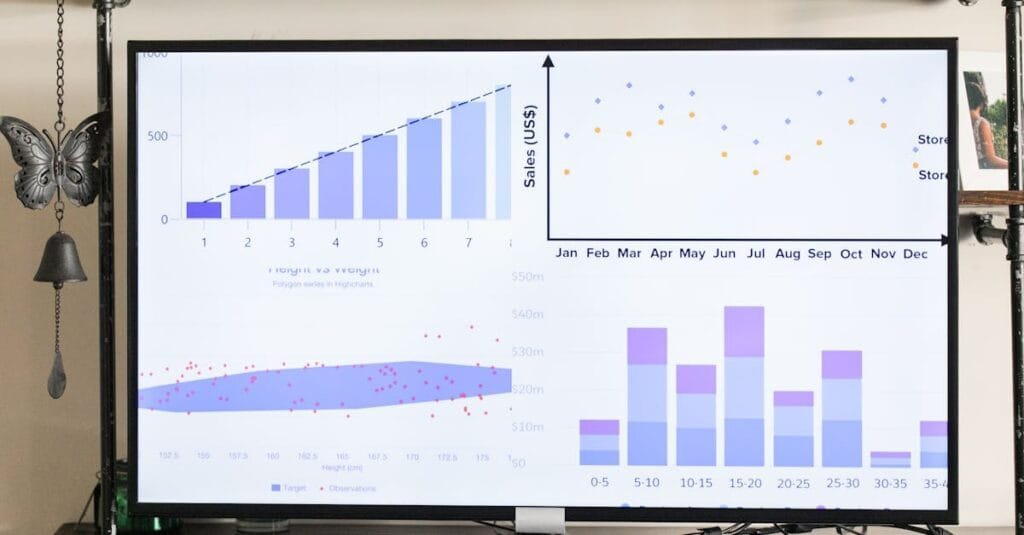
- Graphs help illustrate trends over time.
- Heat maps can pinpoint problem areas quickly.
- Bubbles can showcase relationships between different metrics.
Remember, the goal is to enhance understanding and drive action based on what you’re seeing. A buddy of mine once created a dashboard filled with line charts that only the engineering team understood. Not very effective, right?
Adapting Your Dashboard for Change
The only constant in shared services is change.
Whether it’s shifting market dynamics or internal growth, your KPI dashboard should evolve. Regularly review the KPIs, even monthly, to assess their relevance.
- Ask, “Is this KPI still serving its purpose?”
- Be open to tweaking your dashboard based on feedback.
Think of it as a living document. One where collaborators can express concerns or suggestions. This culture of transparency is a game-changer for people and culture in your GBS ecosystem.
Engaging Your Team with KPIs
No one wants to be just another number.
Get your team involved in the KPI conversation. They are not just passive observers; they are active participants in shaping the success metrics.
- Hold workshops where you discuss which KPIs matter.
- Encourage teams to share insights on what they believe indicates success.
When your team connects with the KPIs on a personal level, it’s transformative. Suddenly, it’s not just about staring at numbers; it’s about owning the performance narrative.
Acting on Insights
And here’s the kicker:
What good are the insights you gain from your KPI dashboard if you don’t act on them?
Make it a point to regularly have action-oriented discussions based on your insights. Follow up with your teams and ask, “How can we improve this?” or “What barriers are we facing?”
- Set monthly or quarterly review sessions to analyze dashboard performance.
- Establish clear action items from discussions to keep momentum going.
Your KPI dashboard is not a “set it and forget it” tool; it’s a roadmap to operational excellence.
Final Thoughts: Embracing the Power of KPIs
Mastering KPI dashboards is more than just gathering data—it’s about telling a compelling story about your shared services performance.
I know navigating this can feel overwhelming at times, but break it down. Make it a way of thinking for your team.
Don’t just seek data; seek insights. Don’t just focus on performance; focus on improvement. Your GBS success depends on how well you engage with your KPIs.
For more insights like these, I recommend checking out THEGBSEDGE blog. It’s a treasure trove for shared services topics like transformation and innovation.